After working across dozens of Shopify stores at different revenue stages, the pattern is consistent: the stores that outperform their competitors are not doing something fundamentally different. They are doing the same things — but doing them more completely, more consistently, and more deliberately.
This checklist covers the practices that distinguish high-performing Shopify stores. Use it to audit your own store and identify the gaps.
Conversion Rate and On-Site Performance
- Conversion rate segmented and tracked by device, traffic source, and product category
- Product pages with specific benefit-led headlines (not brand or product name only)
- Hero images showing the product in use by a recognisable customer
- Reviews displayed near the product title with star rating and count visible
- Add-to-cart button is visually prominent and above the fold on mobile
- Returns policy summarised near the ATC button
- Mobile page load time under 3 seconds (LCP under 2.5s)
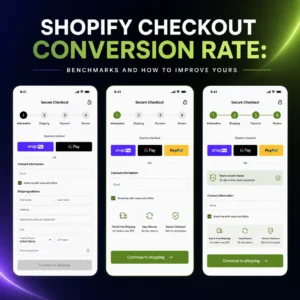
- Guest checkout enabled
- Apple Pay and Google Pay active
- Checkout abandonment rate tracked and below 65%
- Post-purchase upsell or cross-sell active
- Heatmap and session recording tool installed and reviewed monthly
Email Marketing and Retention
- Welcome series (3–5 emails) active for new subscribers
- Abandoned cart flow (3 emails) active
- Post-purchase flow (minimum 3 emails) active
- Winback flow active for customers inactive for 90+ days
- Browse abandonment flow active for high-traffic stores
- Email open rate above 30% (if below, deliverability investigation needed)
- Email list cleaned every 90 days (inactive subscribers suppressed)
- Email generating at least 20% of total revenue
- Customer segments active: VIP, one-time buyers, non-purchasers
Paid Acquisition
- Conversion tracking verified and accurate (cross-referenced with Shopify revenue, not self-reported)
- Dedicated landing pages per ad campaign (not homepage traffic)
- Message match verified between ad and landing page (offer, language, visual)
- Ad creative refreshed at least monthly
- Negative keywords maintained weekly (for Google)
- Retargeting campaign active with segment-specific creative
- Meta Conversions API installed and passing purchase events
- ROAS calculated against actual cost of goods (not revenue only)
Revenue and Customer Economics
- Average order value tracked weekly
- Bundle or free shipping threshold offer active
- Upsell or cross-sell in place on product pages and/or cart
- Repeat purchase rate calculated and above category benchmark
- Customer lifetime value calculated (AOV × frequency × lifespan)
- Customer acquisition cost by channel tracked
- Contribution margin per order calculated (revenue minus COGS, fulfilment, returns, CAC)
SEO and Organic Presence
- Unique meta descriptions on all key pages
- Collection pages with original, keyword-rich descriptions
- Product pages with unique descriptions (not manufacturer copy)
- Google Search Console installed and reviewed monthly
- Blog content published at minimum monthly (informational + commercial intent)
- Internal links from blog to product and collection pages
Analytics and Data
- Google Analytics 4 installed and linked to Shopify
- Weekly metrics review with comparison to prior week and prior year
- A/B test programme active (minimum one test running or queued at all times)
- Post-purchase survey capturing attribution data
- Email list opted in and growing month over month
Case Study: Three USPs Added $70,055 in Annual Revenue for GolfCoursePrint
One of the most consistently underused homepage elements is the trust bar — a concise row of unique selling propositions placed immediately below the hero. For GolfCoursePrint, heatmap analysis showed users were not scrolling far enough to engage with value-building content below the fold.
Adding three USPs — Happy Customers count, Perfect Gift positioning, and 30-Day Satisfaction Guarantee — directly below the hero captured attention before users could leave. The result: a 2.17% conversion rate uplift and an estimated $70,055 in additional annual revenue.
On a homepage where the primary goal is directing users to product pages, surfacing trust signals above the fold shortens the path from first impression to purchase intent. It is the type of change that takes a day to implement and pays for itself in the first week.
How to Use This Checklist
Go through each item and mark it as: done, partially done, or not done. For every “not done” item, estimate the revenue impact of fixing it. Prioritise by impact and ease. Work through the list systematically rather than treating it as an overwhelming total.
The stores in the top 10% by conversion rate and revenue efficiency are not doing things on this checklist better than you could. They are simply doing more of them, more consistently. Every item you move from “not done” to “done” compounds into better store performance over time.
Want help working through this checklist and identifying which items would have the biggest impact on your specific store? Get a free Shopify audit — we will assess your store against this framework and give you a prioritised action plan.