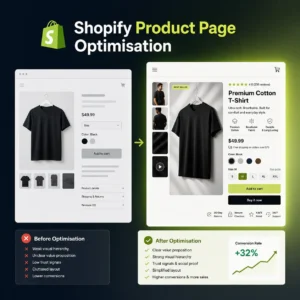
“What should my Shopify conversion rate be?” is one of the most commonly asked questions in ecommerce. Well, the average Shopify store converts at 1.3% to 1.4%.
Competitive categories like fashion and accessories typically sit lower, at 1.0% to 1.2%. If your store converts above 3.5%, you are in the top 20% of Shopify merchants. But the benchmark that matters is yours: track your conversion rate by traffic source and device, then beat it month on month.
A store converting at 2% with profitable unit economics outperforms a store at 4% losing money on every order.
Why a Single Benchmark Misleads You
Conversion rate is a function of at least six variables: traffic source, price point, product category, device type, season, and audience intent. Industry averages pool all of these together and produce a number that accurately describes no individual store.
A store selling a $15 candle converting at 4% and a store selling a $3,000 piece of furniture converting at 0.6% can both be performing well for their category. Comparing either of them to an industry average without segmentation is not useful.
What the Shopify Conversion Rate Data Actually Shows in 2026
Most conversion rate benchmarks circulating in Shopify communities are pulled from Shopify’s own aggregate data, third-party studies, and agency audits. They land in broadly the same range: 1.3% to 1.4% across all store types. But these averages hide enormous variation by category, traffic source, and price point.
2026 Shopify Conversion Rate Benchmarks by Category
- All Shopify stores (average): 1.3% to 1.4%
- Fashion and apparel: 1.0% to 1.2%
- Health and beauty: 2.5% to 3.5%
- Food and drink: 2.5% to 4.0%
- Home and garden: 1.4% to 2.0%
- Sports and outdoor: 1.2% to 1.8%
- Top 10% of Shopify stores: 3.5% and above
These ranges reflect 2026 benchmarks aggregated from published Shopify data, ecommerce research reports, and conversion audits across DTC brands. Use them as context, not targets.
Benchmarks That Actually Mean Something
Segment your conversion rate before comparing it to anything. These are the benchmarks we use when auditing Shopify stores.
Segmenty Traffic Source
- Email: 3–5% (warm audience, highest intent)
- Direct: 3–5% (returning customers, brand-aware visitors)
- Organic search: 2–4% (commercial-intent queries convert well)
- Paid search (Google Shopping/Search): 2–3.5% (high purchase intent)
- Paid social (Meta, TikTok): 0.8–2% (interruption-based, lower initial intent)
- Organic social: 0.5–1.5% (browsing behaviour, not purchase intent)
By Price Point
- Under $50: 3–6% (impulse-friendly, low deliberation time)
- $50–$150: 1.5–3.5% (some consideration, price comparison shopping)
- $150–$500: 1–2.5% (higher deliberation, trust-sensitive)
- $500+: 0.5–1.5% (research-heavy, multiple-session decisions)
By Device
- Desktop: 2–4%
- Mobile: 0.8–2.5%
A store with 60% of traffic from cold paid social will always show a lower blended conversion rate than a store with 60% email and organic search traffic. Even if it has better product pages, better pricing, and a better brand. The benchmark comparison is meaningless without this segmentation.
What Benchmarks Don’t Tell You
Knowing your conversion rate is below benchmark tells you there is a problem. It does not tell you where.
The more useful diagnostic is to break down the funnel into three stages and benchmark each one separately:
- Product page to add-to-cart: Target 8–15% for most categories
- Add-to-cart to checkout start: Target 60–80%
- Checkout start to purchase: Target 65–80%
In our Shopify CRO audits, most stores have one specific stage where the majority of revenue is being lost, and it is rarely where the owner assumes. A store with a 0.9% overall conversion rate might have a healthy 13% add-to-cart rate and a severely leaky checkout, so that means the product pages are doing their job. The fix is in the checkout, not in a homepage redesign.
Why Chasing the Industry Average Is the Wrong Move
Here is the problem with benchmarking against industry averages: they include every store in the category, including ones with broken checkout flows, no social proof, and traffic that was never going to buy. Averaging your performance against theirs pulls your target down.
The more useful comparison is your own store over time. Set a baseline for each traffic source separately: organic search, paid social, email, and direct. Each has a different conversion profile because the buyer intent is different. Paid social traffic arriving cold converts at 0.5% to 1.5%. Email traffic from your own list converts at 2% to 5%. Lumping them together produces a blended rate that tells you nothing about where the actual problem is.
How to Use This in Practice
- In Shopify Analytics or Google Analytics 4, segment your conversion data by traffic source
- Compare your mobile vs. desktop conversion rate – a gap larger than 1.5x means mobile checkout needs attention
- Pull add-to-cart rate, checkout start rate, and checkout completion rate separately
- Find the stage with the worst drop-off – that is where to start optimising
The Four Conversion Rate Killers on Shopify Stores
After running conversion audits across dozens of Shopify stores, the same issues come up repeatedly. They are not subtle. Most store owners know the problem exists; they just have not yet fixed it.
1. Page Speed Below 3 Seconds on Mobile
Google’s own data shows that a one-second delay in mobile load time can reduce conversions by up to 20%. If your Shopify store takes more than three seconds to load on a mid-range Android device, you are losing buyers before they see the product. Theme bloat, uncompressed images, and too many third-party apps are the usual culprits.
2. No Social Proof at the Decision Point
Buyers need confirmation that other people have bought this and been satisfied. Reviews, star ratings, and user-generated content need to appear on the product page, near the add-to-cart button, not buried below the fold. A store with 200 reviews that hides them at the bottom of the page converts worse than a store with 20 reviews displayed prominently.
3. Checkout Friction
Shopify’s native checkout is already well optimised. The friction usually comes from forced account creation, unexpected shipping costs revealed at checkout, or a checkout page cluttered with upsells that slow the buyer down. Remove the obstacles between the buyer and the confirmation page.
4. Cold Traffic with No Pre-Qualification
If your paid social campaigns are sending cold audiences directly to a product page, most of them will leave. The store is not broken; the cold-traffic funnel is. Buyers who arrive from a retargeting ad or a warm email sequence convert at three to five times the rate of cold traffic. Build a funnel that warms buyers before asking them to purchase.
What Good Conversion Looks Like at Each Stage
Instead of watching only the checkout conversion rate, track the full funnel. Knowing where buyers drop off tells you exactly where to focus your optimisation effort.
- Homepage to product page: 30% to 40%
- Product page to add to cart: 8% to 12%
- Cart to checkout initiation: 40% to 60%
- Checkout initiation to purchase: 55% to 75%
If your cart-to-checkout rate is below 35%, the issue is usually trust: buyers are not confident enough to enter their payment details. If your checkout-to-purchase rate is below 50%, the issue is usually friction or unexpected costs. Each stage has a different fix.
There is no single lever. Conversion rate improvement is the combined result of fixing the product page, building trust signals, reducing friction in the cart, and sending better-qualified traffic.
If you are not sure where your store is losing buyers and want a clear read on where your funnel is losing revenue, get a free CRO audit. We will tell you exactly where you stand and what to fix first.
A good Shopify conversion rate depends on your category and traffic source. The platform average is 1.3% to 1.4% across all stores. If you are converting above 2.5%, you are performing above average. If you are above 3.5%, you are in the top 10% of Shopify merchants. Focus on improving your own baseline rather than matching an industry average that includes stores with very different products and audiences.
Shopify calculates conversion rate as the percentage of sessions that result in a purchase. You can find it in Shopify Analytics under Overview or in the Conversion summary report. For a more accurate picture, filter by traffic source: check your organic, paid, email, and direct channels separately. A blended rate hides where the real problem is.
Yes, 2% is above the Shopify platform average of 1.3% to 1.4%. Whether it is good for your specific store depends on your profit margins, average order value, and traffic quality. A store with a 2% conversion rate and a £90 average order value will outperform a store with a 4% conversion rate and a £20 average order value in terms of revenue per session.
The most common causes are slow page speed on mobile, lack of social proof near the add-to-cart button, checkout friction such as forced account creation or unexpected shipping costs, and cold traffic that was never going to buy. Run a funnel analysis to find where buyers are dropping off: homepage to product page, product page to cart, cart to checkout, and checkout to purchase. Each drop-off point has a different fix.